Price per square foot: how to calculate it and use it
How to calculate price per square foot, which area and price to use, a worked set of comparable sales, and how to use the figure in a listing appointment.
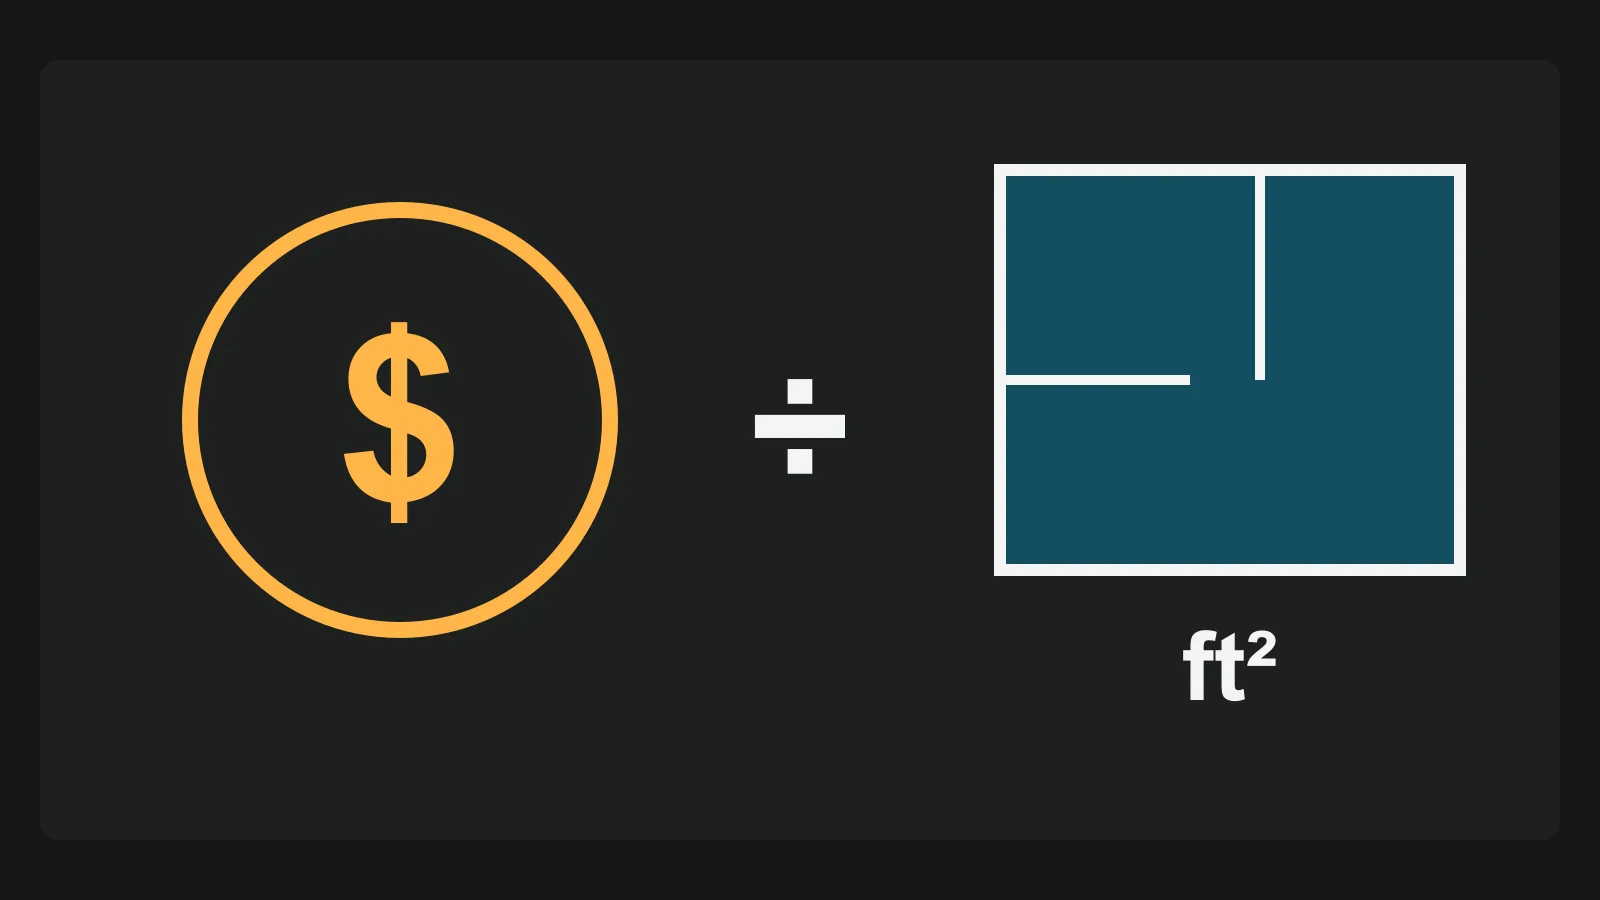
To calculate price per square foot, divide the home's price by its living area: $450,000 ÷ 1,500 sq ft = $300 per sq ft. The sum is the easy part. The figure only works when every home you compare uses the same kind of price and the same kind of area. This guide covers those choices, a worked example, and how to use the number in a listing and with a seller. The rules and data here are from the US; elsewhere, use your market's area rule and sale data.
How to calculate price per square foot
| You want | Sum | Example |
|---|---|---|
| The figure | Price ÷ area | $450,000 ÷ 1,500 = $300 per sq ft |
| A price from a figure | Figure × area | $305 × 1,500 = $457,500 |
| The area a budget buys | Budget ÷ figure | $450,000 ÷ $300 = 1,500 sq ft |
Vistura's free price per square foot calculator does this from the rooms up, with no account. Add each level or room as a row, untick "Counts toward the living area" for the garage and basement, and type the "Asking price (optional)". It shows the price per square foot of living area, and "Copy as text" gives you the list. You can type a sale price in the same box when you work on a comparable.
Which area goes under the line
This is where most wrong figures come from. In the picture, the same home at the same $450,000 gives two very different results.
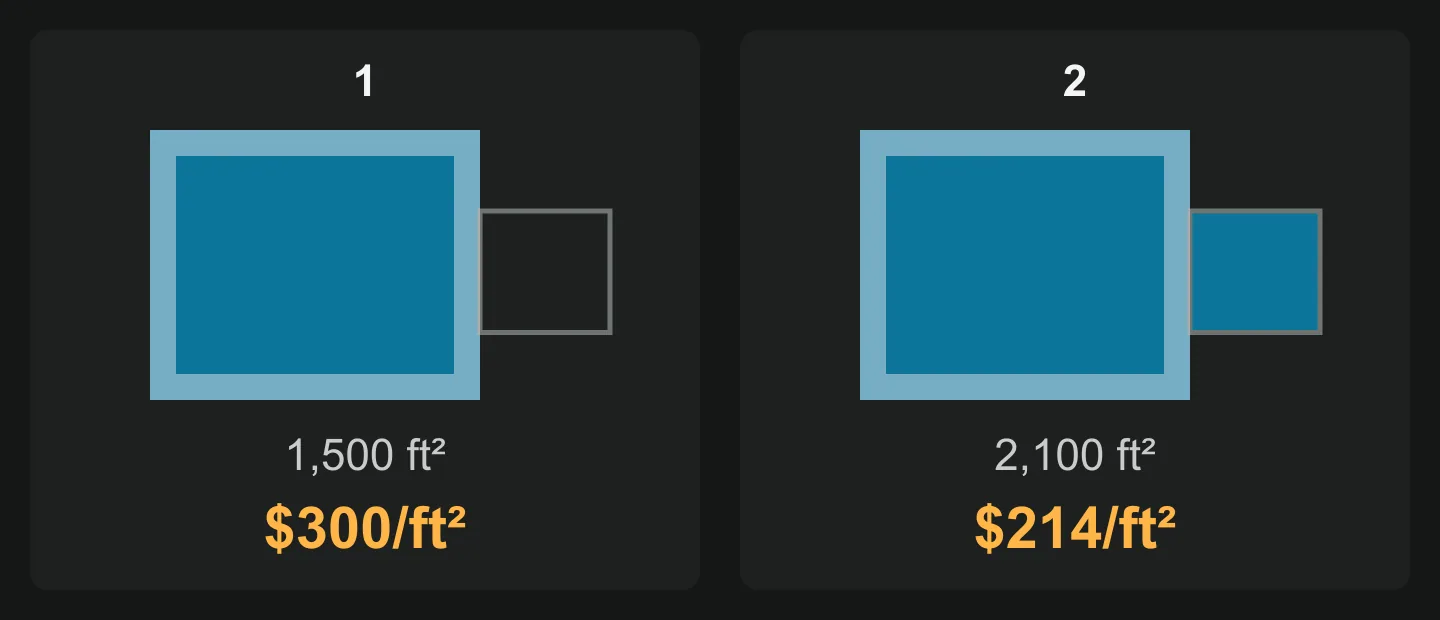
Use above-grade finished area, measured the same way for every home. That is the figure Fannie Mae's appraisers report, with below-grade area on its own line. How to get it is in our guide on how to measure square footage.
Before you trust a comparable's figure, ask three things:
- Does it include a basement? Your MLS may hold one combined total. Divide again if it does.
- Was it measured from outside or room by room? Rooms measured inside leave out the walls, so the same home shows a smaller area and a higher price per square foot.
- Is it a condo? Fannie Mae's appraisers measure condo units from inside, so compare them only with other condos.
Which price goes on top
| Price | What it tells you | Where to find it |
|---|---|---|
| Sale price | What a buyer paid | Your MLS |
| List price | What sellers hope for | Your MLS; county figures from Realtor.com on FRED (Multnomah County, Oregon, as an example) |
| New-home medians | The market for new builds, by region | US Census Bureau tables |
Keep national and regional figures as background. The US Census Bureau's median for new homes sold in 2023 ran from $146.64 in the South to $220.95 in the Northeast. That says nothing about one street, and it describes new homes.
A worked example
You are pricing a 1,500 sq ft home. You pull four sales from the last few months, all close by and close in size. The sales and homes here are made up.
| Sale | Price | Sq ft | Per sq ft | Note |
|---|---|---|---|---|
| A | $438,000 | 1,460 | $300 | Similar condition |
| B | $465,000 | 1,500 | $310 | Similar, slightly better lot |
| C | $399,000 | 1,400 | $285 | Dated kitchen and baths |
| D | $552,000 | 1,600 | $345 | Fully renovated |
Now line them up.
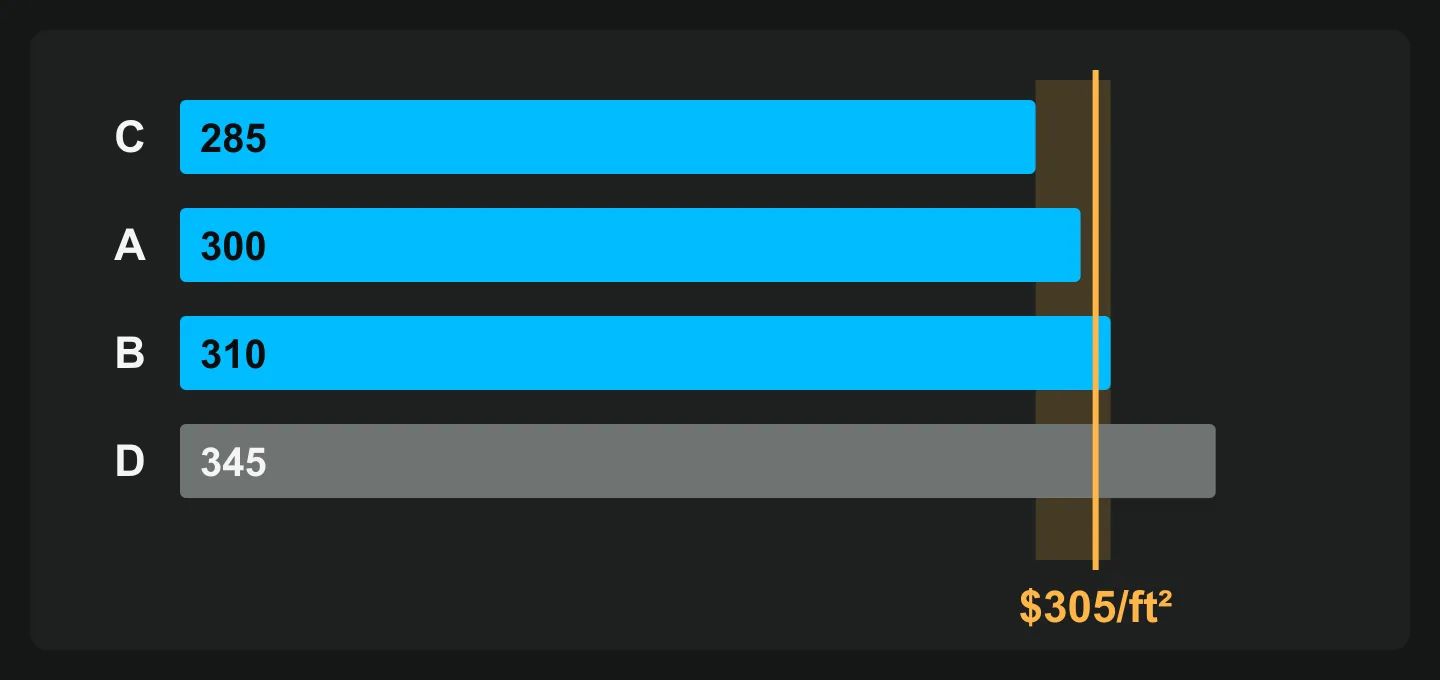
The middle of the four is $305, halfway between A and B. Using the middle keeps D, the renovated home, from pulling the result up the way an average would. Leave D out of the range unless your home is renovated too: C to B gives $285 to $310.
Multiply by the home's area: 1,500 × $285 = $427,500 and 1,500 × $310 = $465,000. So your starting range is $427,500 to $465,000. The middle gives 1,500 × $305 = $457,500.
Why the figure misleads on its own
- Size. Bigger homes usually show a lower figure. Appraiser Ryan Lundquist puts it down to building cost: a house twice the size is probably not worth twice as much. Compare homes close in size.
- Land. A large lot or a view raises the price and not the floor area, so the figure rises with nothing inside to show for it.
- Condition and layout. The figure treats a dated kitchen like a new one, which is exactly the gap between C and D above.
- Rules of thumb. Fannie Mae's guide says appraisers' adjustments "must reflect the market's reaction" and warns against a per-square-foot adjustment "based on a rule-of-thumb". Treat your own figure the same way.
How to use it in a listing
Most listings do not need the figure in the text, because buyers can divide. If you do state it, say what it rests on:
$300 per sq ft, based on 1,500 sq ft of above-grade finished area (appraisal, [date]).
Then use the description to explain why the home sits where it does. A figure above the area's is a claim, and the new roof, the renovated kitchen or the lot is your evidence. The listing description guide has the wording.
How to use it with a seller
A listing appointment is where the figure earns its keep, as part of the plan you bring (see how to get real estate listings). This order works without a fight:
- Agree the area first. Show how the home was measured, before any price comes up.
- Show sales, then the range. Put the table on the table. Let the seller place their home among the four: is it more like C or like D?
- Say what moves it. Name each reason in plain terms: "Your kitchen is closer to C, your lot is better than B."
- Answer "my neighbour got more". Ask for the address, then check the same three things: which area, which date, what condition. Often the gap explains itself.
- Name the review date. Agree when you will look at the market response together, and what would change the price.
Say clearly that this is a market analysis to set a listing price, not an appraisal.
Show what the number cannot
Price per square foot leaves out what buyers pay extra for: light, layout and condition. A 360 tour shows them. In a Vistura tour, buyers walk from room to room from one link, so they can see why this home sits above the street's figure before they book a viewing.
On Pro and Business, the "Owner report" brings the fifth step to life: you send the seller the tour's visits, the time spent, the rooms viewed most and the contact requests, with your own note and brand. When the review date comes, you talk about what buyers actually did, not opinions. "Before you call" shows you what each lead looked at. See the plans.
The short version
Divide the sale price by above-grade finished area, for homes alike in size and place. Use the range, not one number, and explain where the home sits and why. When you have a home to price, run the rooms through the calculator.
Frequently asked questions
What is a good price per square foot?
There is no good figure on its own. It only means something next to recent sales of similar homes in the same area, measured the same way. A number that looks high in one neighbourhood can be normal two streets away.
Do you include the garage in price per square foot?
Not in the usual calculation. Divide by finished above-grade area and list the garage apart. If a comparable's figure includes one, recalculate it before you compare.
How do I turn price per square foot into a home's value?
Multiply the middle figure of your comparable sales by the home's area for a starting range, then adjust for what differs. That gives you a talking point for a pricing conversation. For a figure a loan or a court depends on, use a licensed appraiser.
Should I use the list price or the sale price?
Use the sale price for comparable sales, because that is what a buyer actually paid. Keep list prices for homes on the market now: they show your competition.